Normal Blood Sugar Levels Charts for Children, Teens, Adults, and Older Adults

According to the American Diabetes Association (ADA), normal blood sugar levels for the majority of non-pregnant adults with diabetes is 80–130 mg/dL before meals and ⩽180 mg/dL after meals. But what about kids and older adults with diabetes? Let’s check it out in our blood sugar levels charts.
In the article, we explain how blood glucose levels change by age, what common reasons for the changes exist for each group, and how the InRange app can help you stay within your perfect range most of the time.
Curious to learn how an innovative approach to app development helps people live longer by deeper understanding their diabetes?
Blood sugar levels charts by age
Blood sugar levels for those with diabetes change individually. Readings depend on age, complications a person has experienced, other illnesses, and damage to the pancreas.
Let’s check out what’s meant to be normal for both children and adults, according to recent research and medical specialists’ opinions.
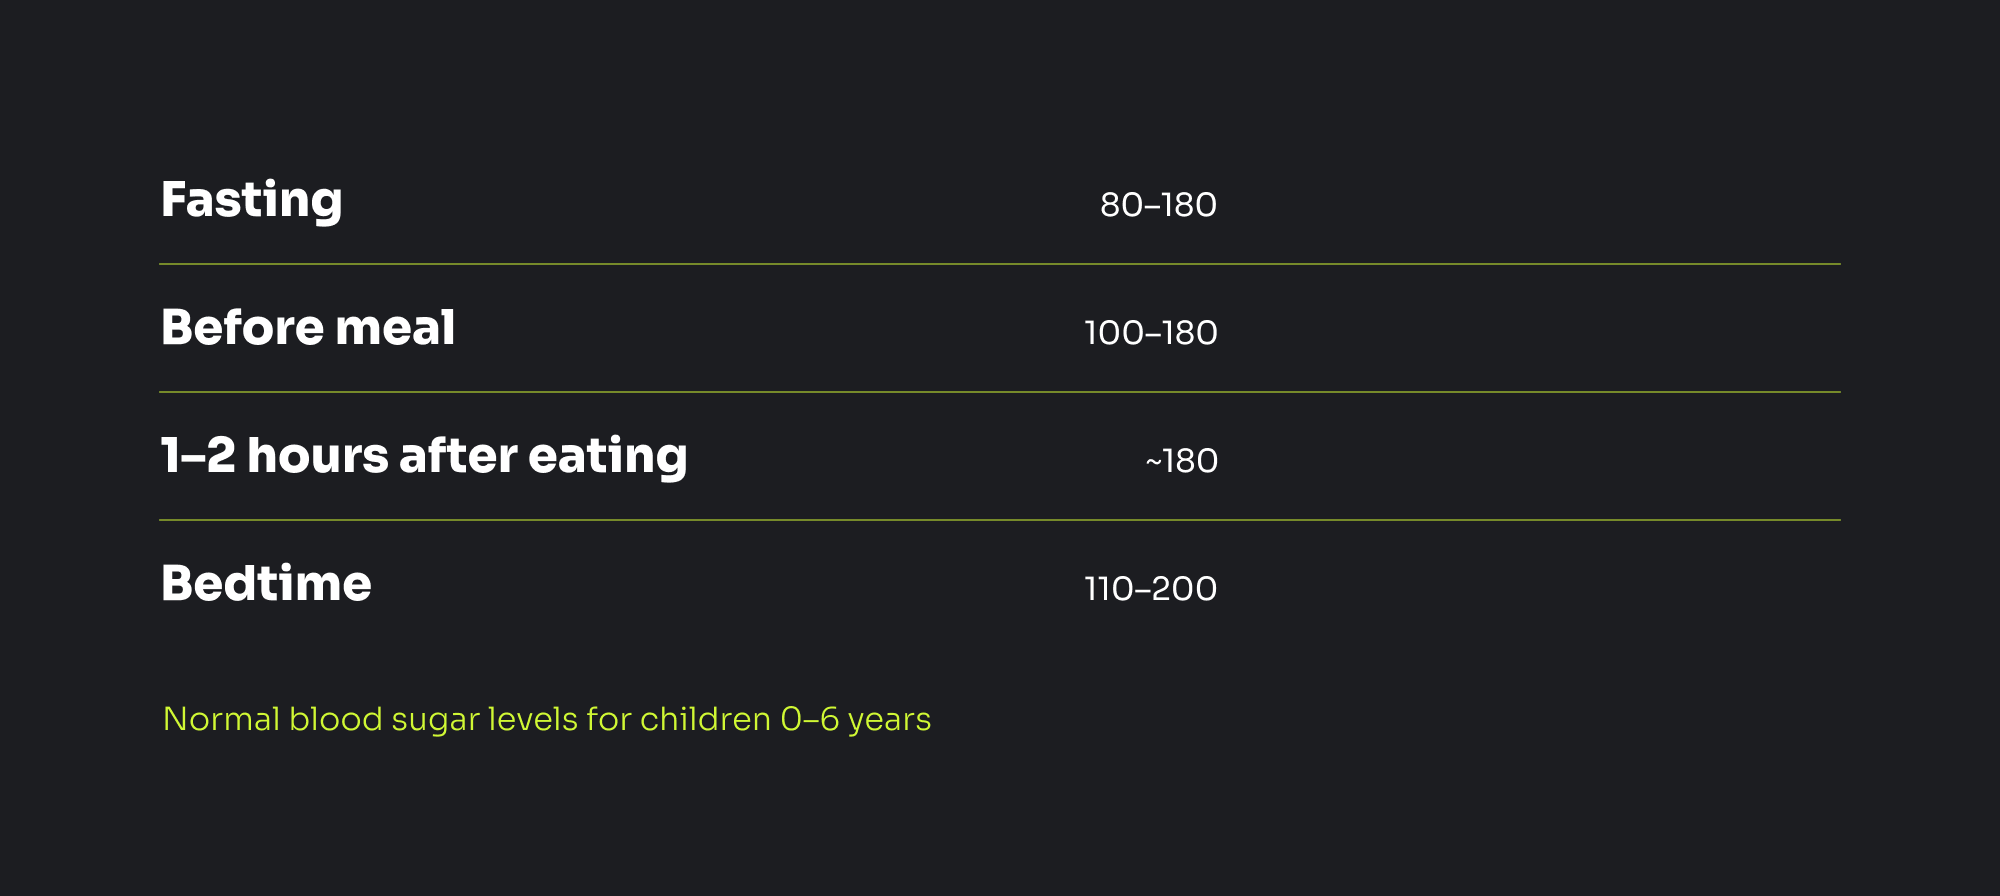
Charts for children with diabetes
For children of the age of <6 years old, the target blood glucose level is <180 mg/dL throughout a day, and <200 mg/dL at bedtime.
For children of the age of 6–12 years old, there's no need to frequently check blood sugar levels unless they are diagnosed with type 1 diabetes.
In this case, the target levels depend on nutrition, activity level, and other individual factors, but blood glucose shouldn’t rise higher than 180 mg/dL throughout a day.
Below you can see a chart for children with type 1 diabetes.
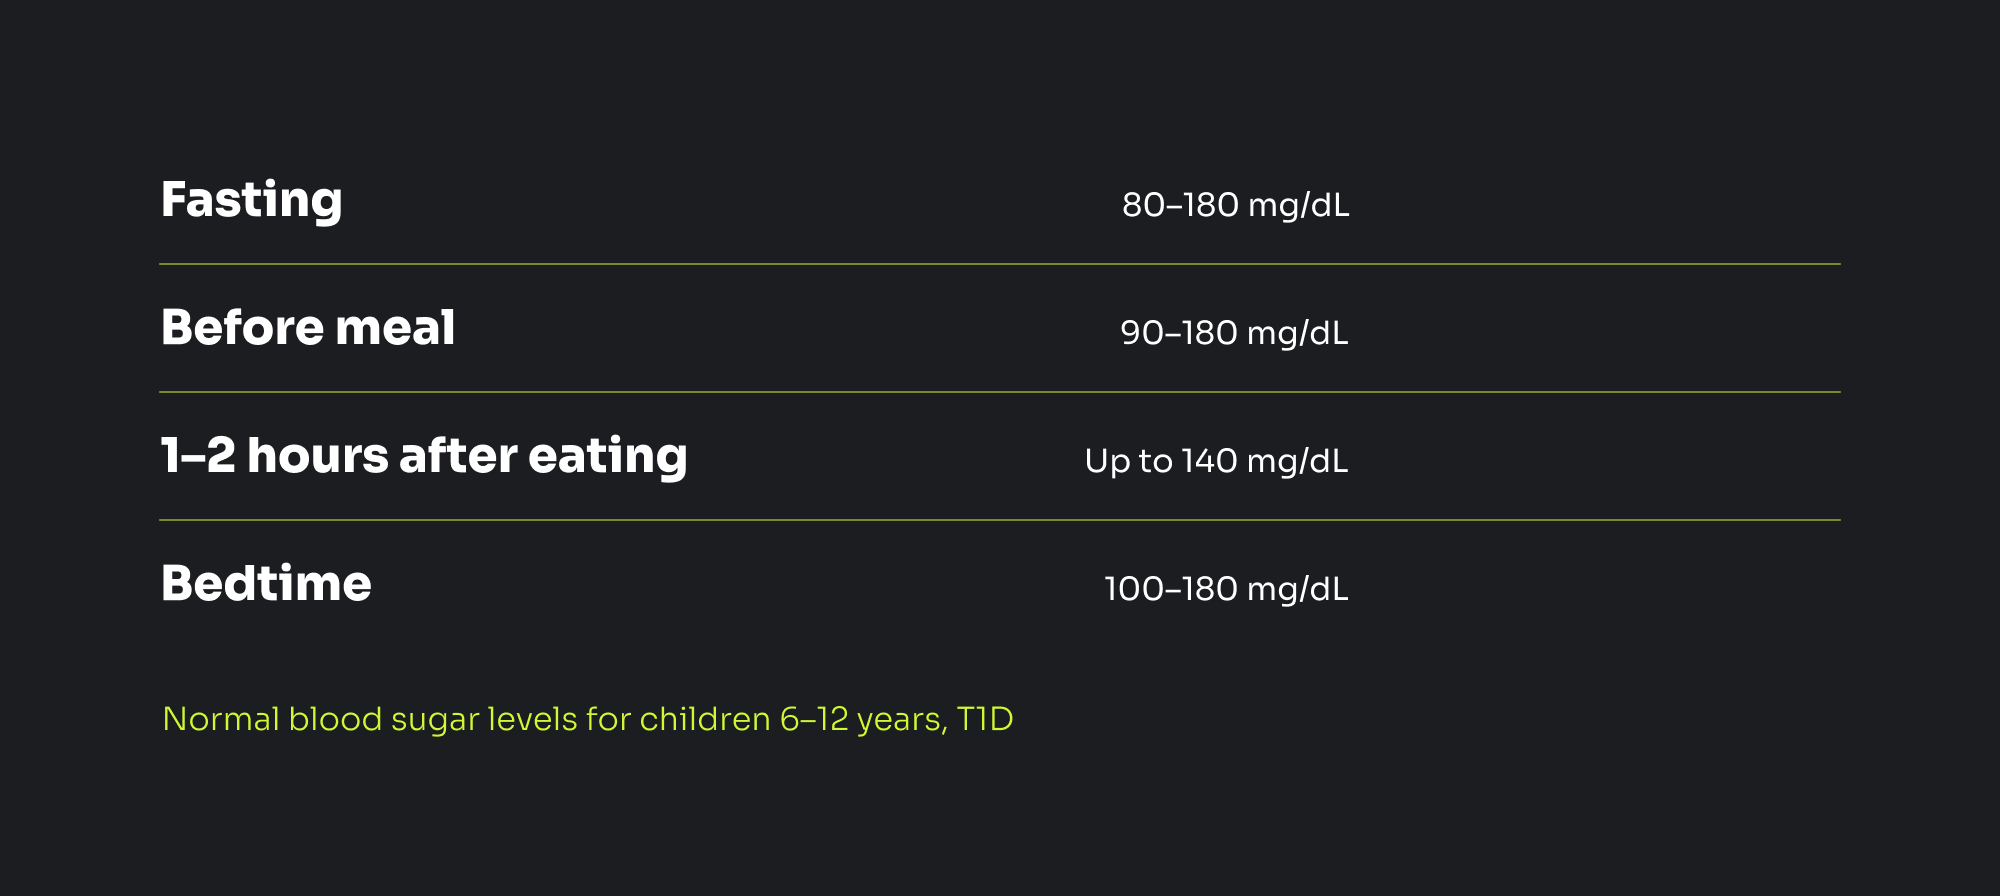
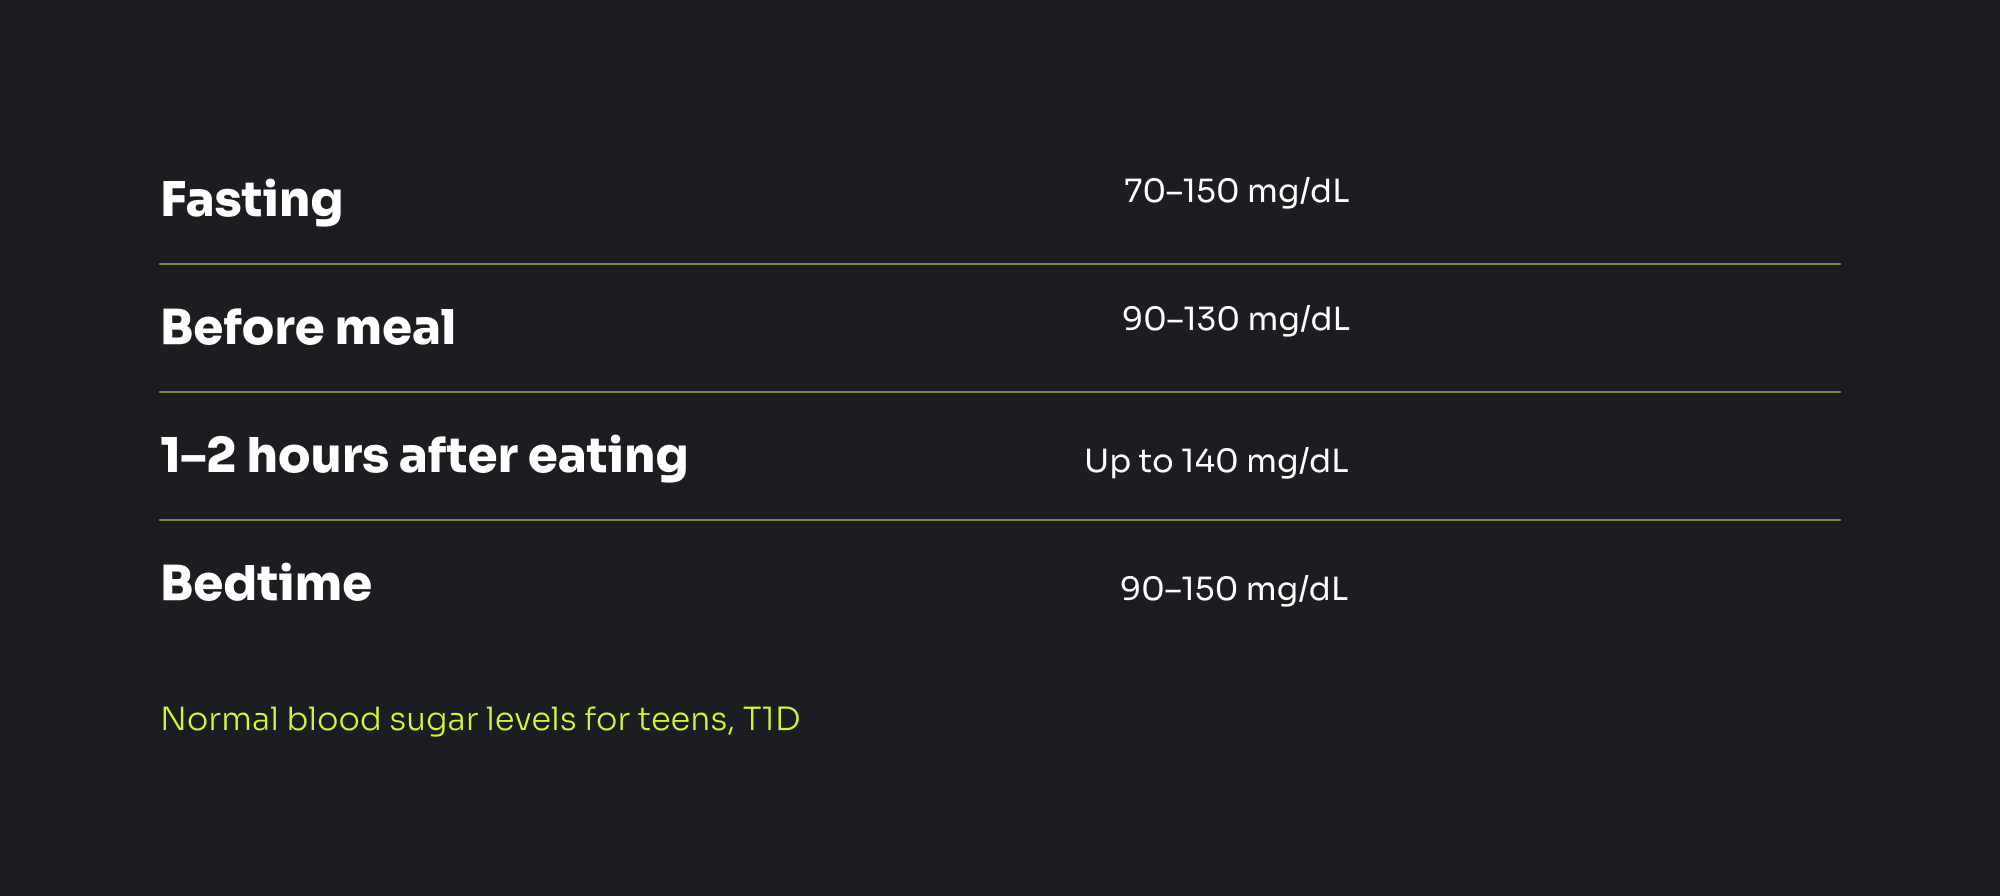
Chart for teens with diabetes
The American Diabetes Association doesn’t offer specific guidance for teenagers with diabetes. But there is a recent research offering some target ranges for teens with type 1 diabetes.
According to another document, for children and adolescents with T1D, the chart is the following. It is also noted that distinguishing between T1D and T2D diabetes in children can be difficult because of the current obesity epidemic.
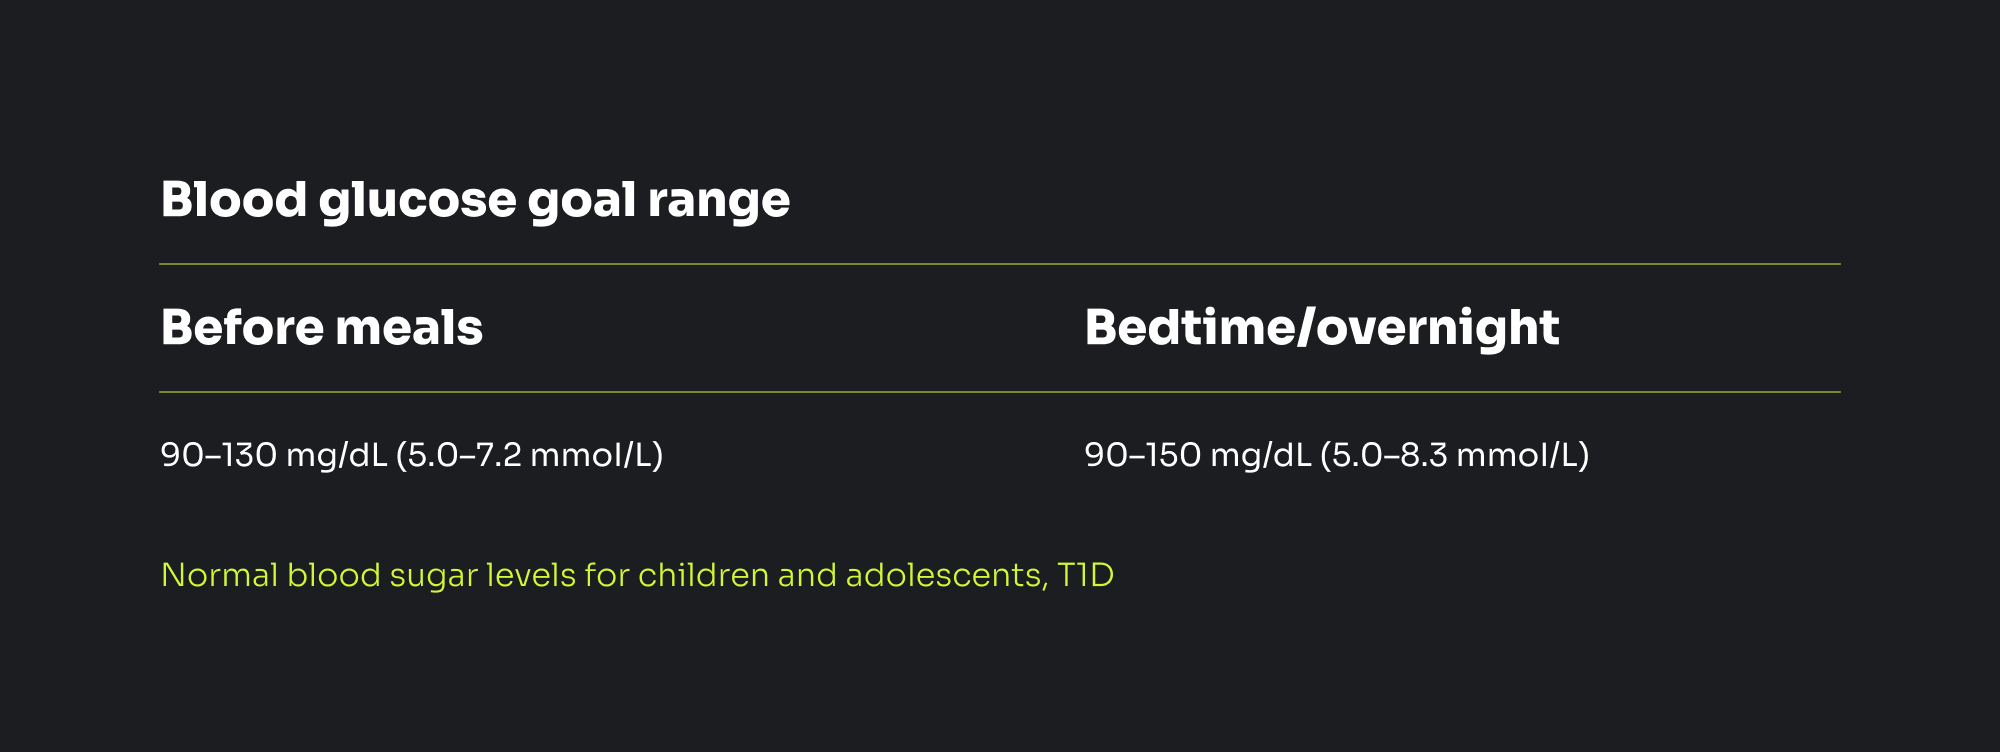
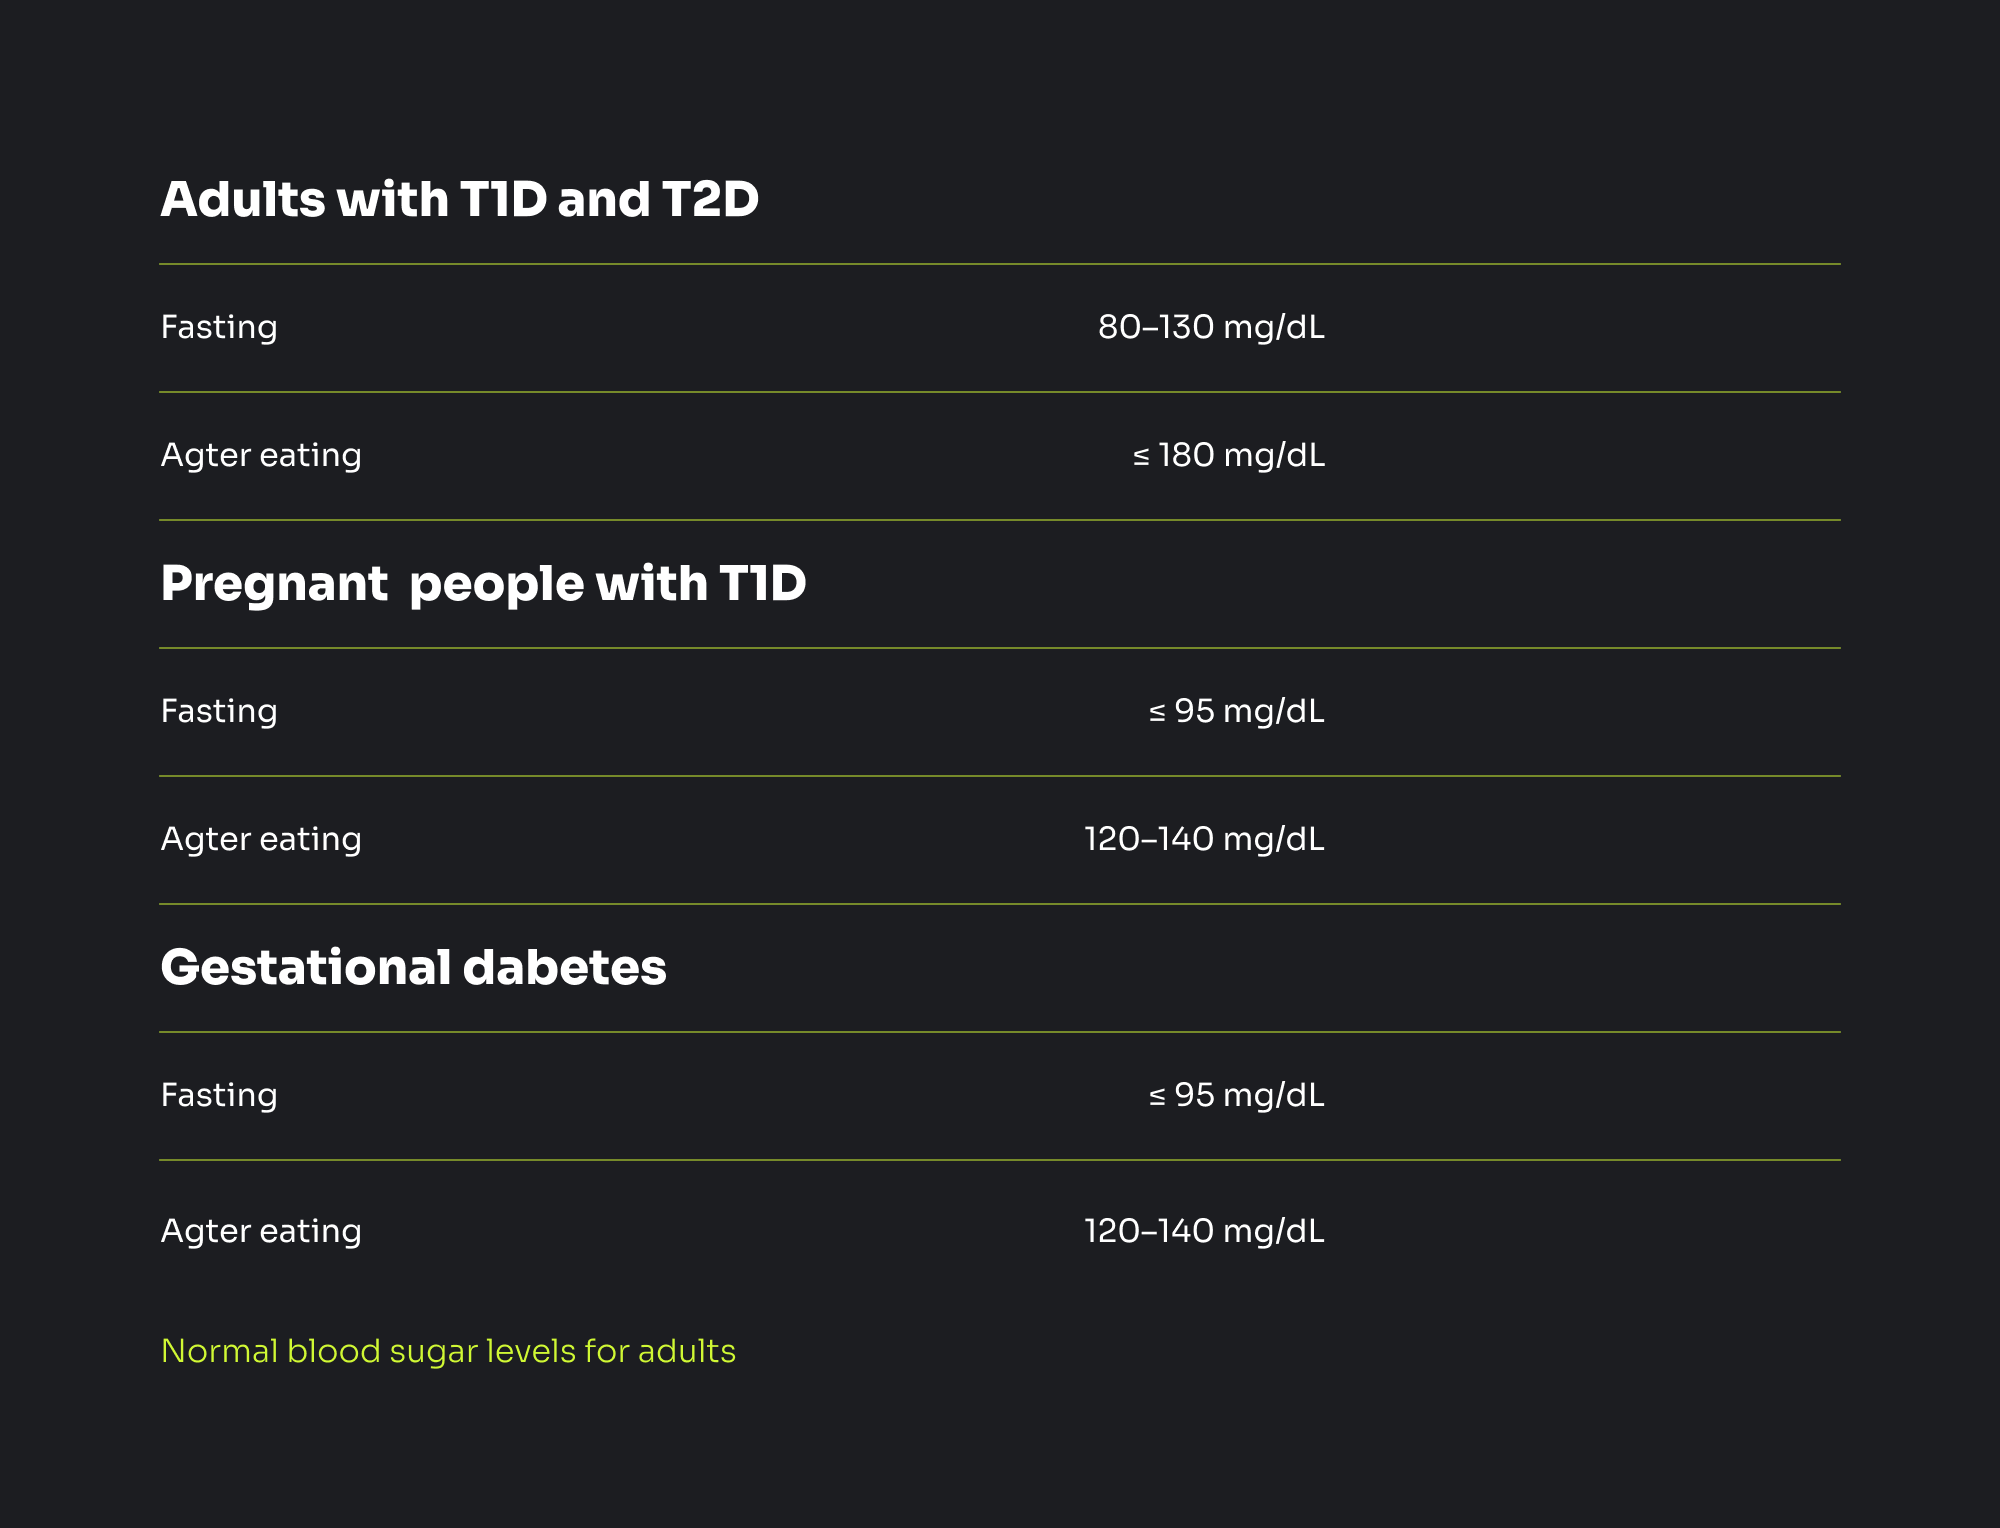
Chart for adults with diabetes
For people of 20+ years old, normal sugar levels depend on the type of diabetes. It can be T1D, T2D, and gestational diabetes (for newly diagnosed pregnant women).
Your personal target ranges depend on numerous factors: medication, activity, weight, kidneys and pancreas condition, and more.
Note: according to the ADA document, normal ranges for adults with T1D and T2D are optimal also for kids with T2D.
Need more detailed information about normal blood sugar levels for adults with and without diabetes and medical advice to control it?
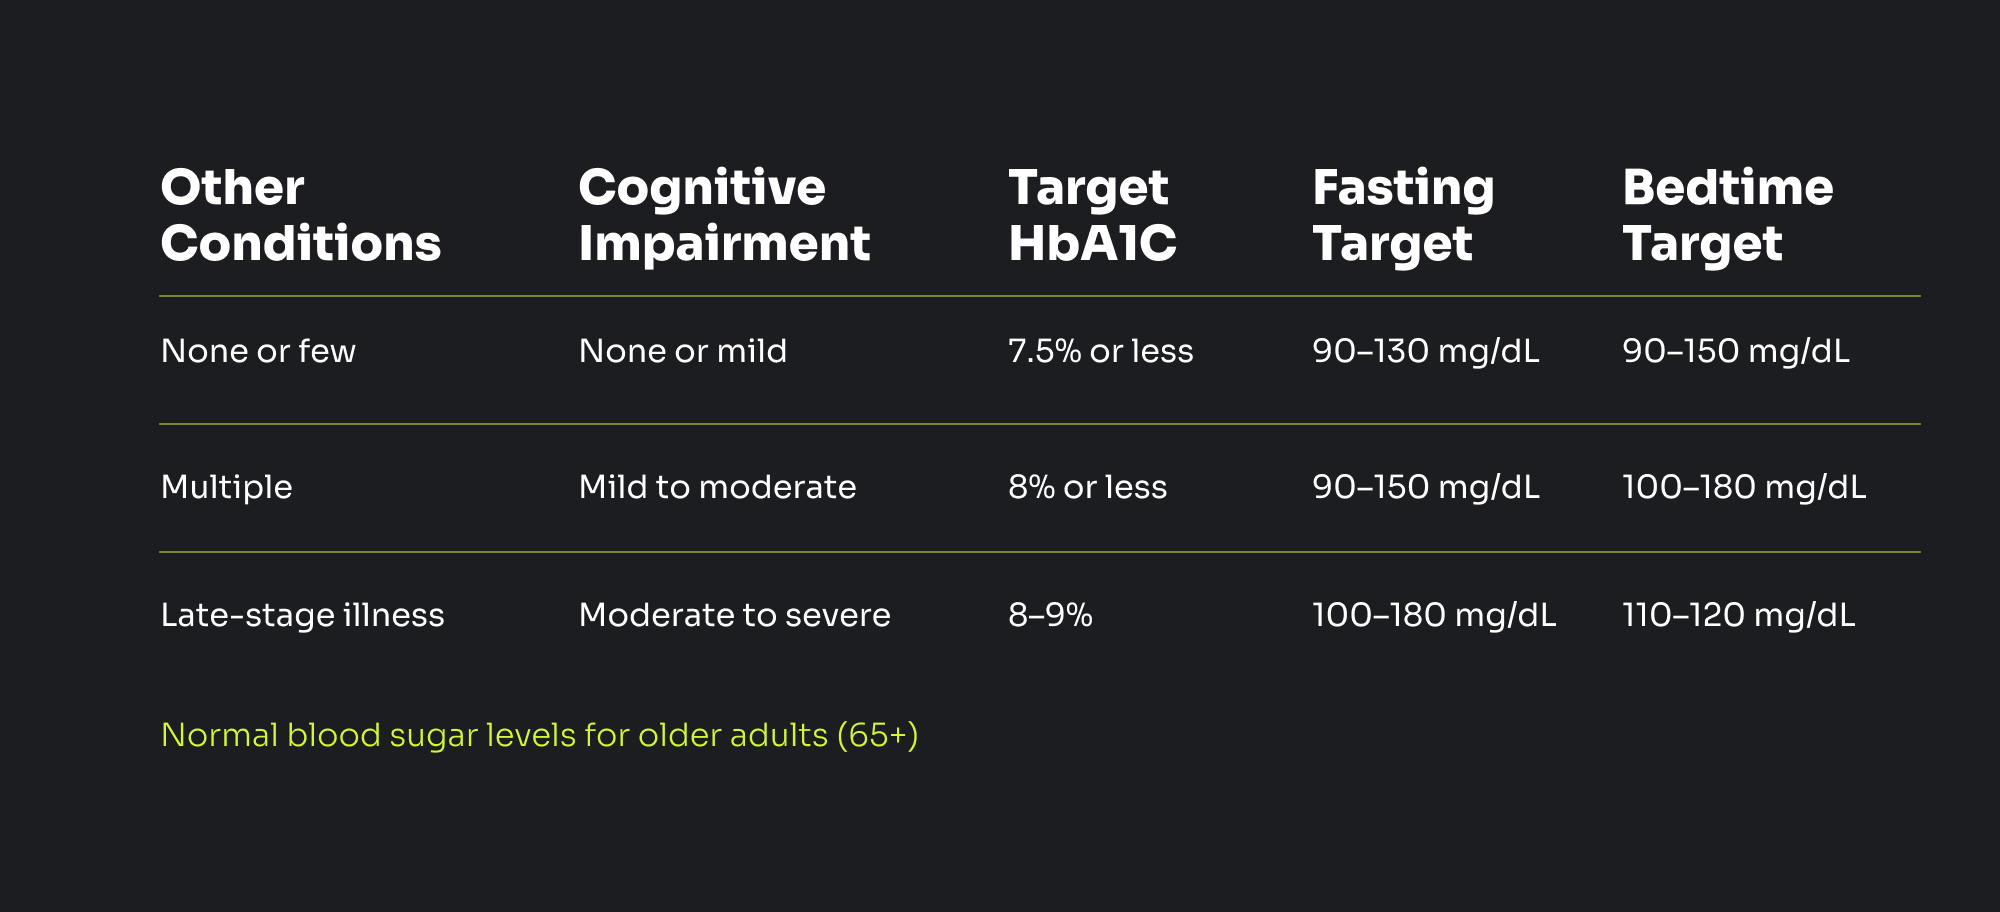
Chart for older adults with diabetes
For diabetics of the age of 65+, normal levels depend on how much damage is done to the pancreas through the time a person is in the condition and what diabetes complications they have faced. It can be neuropathy, retinopathy, kidney damage, and others. Below you can see fasting target, bedtime target, and A1C target after taking into account the factors.
Note: to know your personal target range, you should visit your doctor.
How the InRange app can help people with diabetes stay in range
With the diabetes management app, you can easily control your condition by monitoring convenient blood glucose charts and graphs.
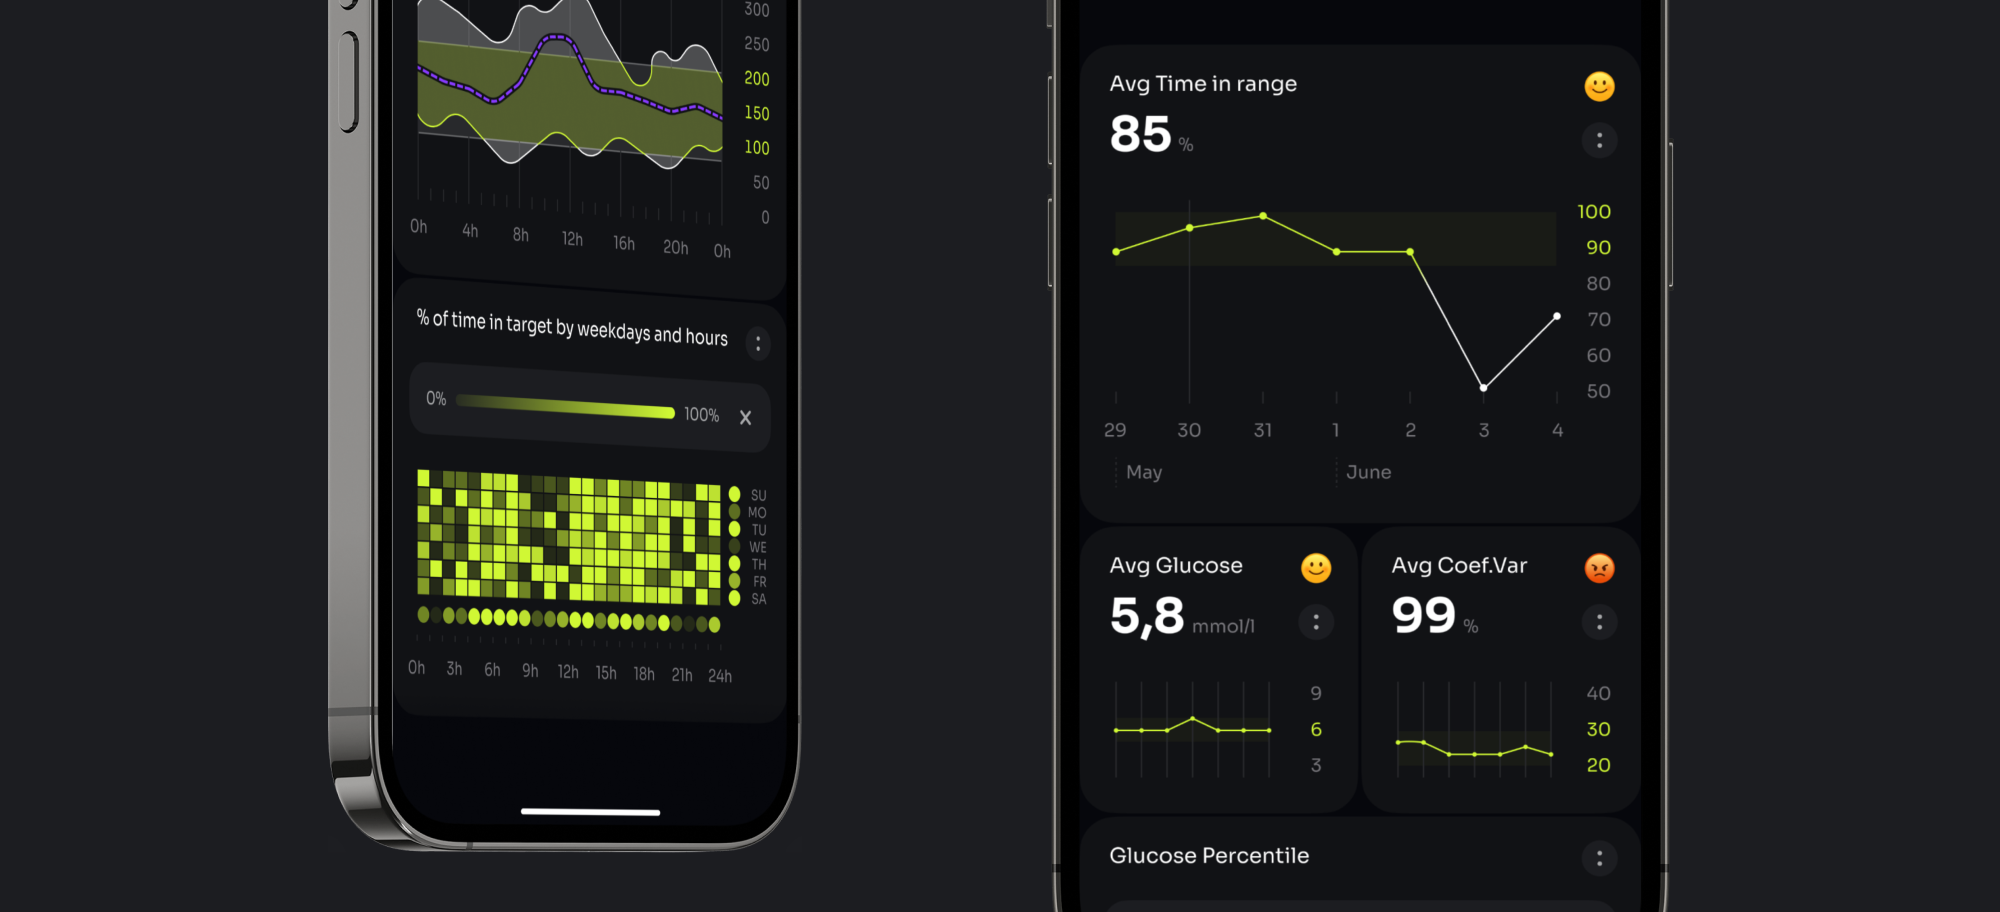
- TIR (Time in Range) is the main graph. It shows how long you’ve been in your personal range for the selected period of time. Focusing on relative results, you can easily find out your individual patterns of glucose level changes, identify the reasons for the risings and fallings, and take measures to be in your perfect range most of the time.
- Glucose level graph shows absolute glucose values for the selected period (days, weeks, and months). If drops between adjacent periods are too sharp, it’s a sign that you need to change your lifestyle or medication plan for better controlling diabetes.
- Coefficient of variation graph shows the percentage of cases when standard deviation is of the average glycemic value. Usually, it shouldn’t exceed 36%.
The app analyzes your CGM (Continuous Glucose Monitoring) data by integrating with other healthcare apps you use. Apple Health, Nightscout, and Dexcom are among the apps integrated with InRange.
Using the app, you can also monitor your loved one’s CGM data to find out whether the person needs your help and control the condition together.
All these features are only the beginning of your diabetes management journey. We try our best to take care of people and their health and add new functions regularly.
Wrapping up
The American Diabetes Association (ADA) offers the same normal sugar level ranges for all non-pregnant adults with diabetes without any strict dividing by age. The only difference is in diabetes type. To learn your personal target ranges, you should take into account your health condition as well as your pancreas condition.
We offered blood glucose charts and graphs based on both ADA recommendations and recent research about controlling diabetes in different ages to show you the full picture.
Innovative technologies like the InRange app can become your personal assistant to help you feel better and live longer with more successful diabetes management. Try it and learn more about understanding your body needs.